Scenarios in FHI Strategy for Developing Scenarios Steps
March 28, 2019 at 12:37 AMStep 1: Determine Number of Scenarios
Selecting number of scenarios that a study will present is a trade-off between a few factors, namely: amount of resources available to devote to developing scenarios, covering the main questions arising from the decision-making process and the scientific rigor by which the scenarios can be analyzed and results presented. Pillkan (2008) proposed the following evaluation of the number of scenarios in a project. Generally, estimating resources to carry out 4-5 scenarios is good starting goal that can be revised later.
Table: Number of Scenarios in a study and its implications (Pillkan 2008)
| Number | Implication |
|---|---|
| 1 | It will be the most likely scenario, though it is convenient for strategy formulation, but one scenario will not yield any alternate future or future options |
| 2 | Two scenarios are usually based on two extreme situations (optimistic and pessimistic scenarios) which are difficult to handle in the context of evaluation |
| 3 | Recommended by many researchers but there is a risk of focusing on the middle (most likely) scenario |
| 4-5 | Possible, narrative value |
| > 5 | Possible, but cost of drafting and evaluating large number of scenarios will be very high and not justifiable |
Step 2: Articulate Main Driving Forces
We will primarily deal with the 3 categories of driving forces defined in Section 9.2. Define time-scale for the scenario planning (5-50 years) followed by articulating the main driving forces in quantitative and qualitative terms.
These may be derived from models, legislature or planning documents as seen in the few examples below:
-
Climatic: Downscaled from GCMs.
-
Land-Surface: Land cover change models, population change projections, changed agricultural practice, etc.
-
Water bodies: Built infrastructure including dams, flood defenses, wastewater management; change in operation rules of reservoirs
Step 3: Cluster Driving Forces
This step is expected to be carried out through stakeholder interaction and requires communicating the main expected driving forces to a lay audience. With a list of driving forces, they can now be integrated under 3 broad themes:
-
Isolated: Under this an individual driving forces form a potential scenario by itself. For example, a climate change-based scenario for 2050.
-
Combined: Under this a couple of driving forces are combined without influencing each other to form a potential scenario. For example, if planning commission plans to change all pasture to irrigated land in basin by 2050; and precipitation is expected to decline by 20% by the same years, the models are applied simply combining these two forces without considering re-alignment of commission's plans considering decreased precipitation.
-
Transformative: Under this, exploration of the driving forces alongside stakeholders leads to a better understanding of the influence of one driving force on another (Figure 9.2). Though this, an understanding of a possible new state of the basin is derived.
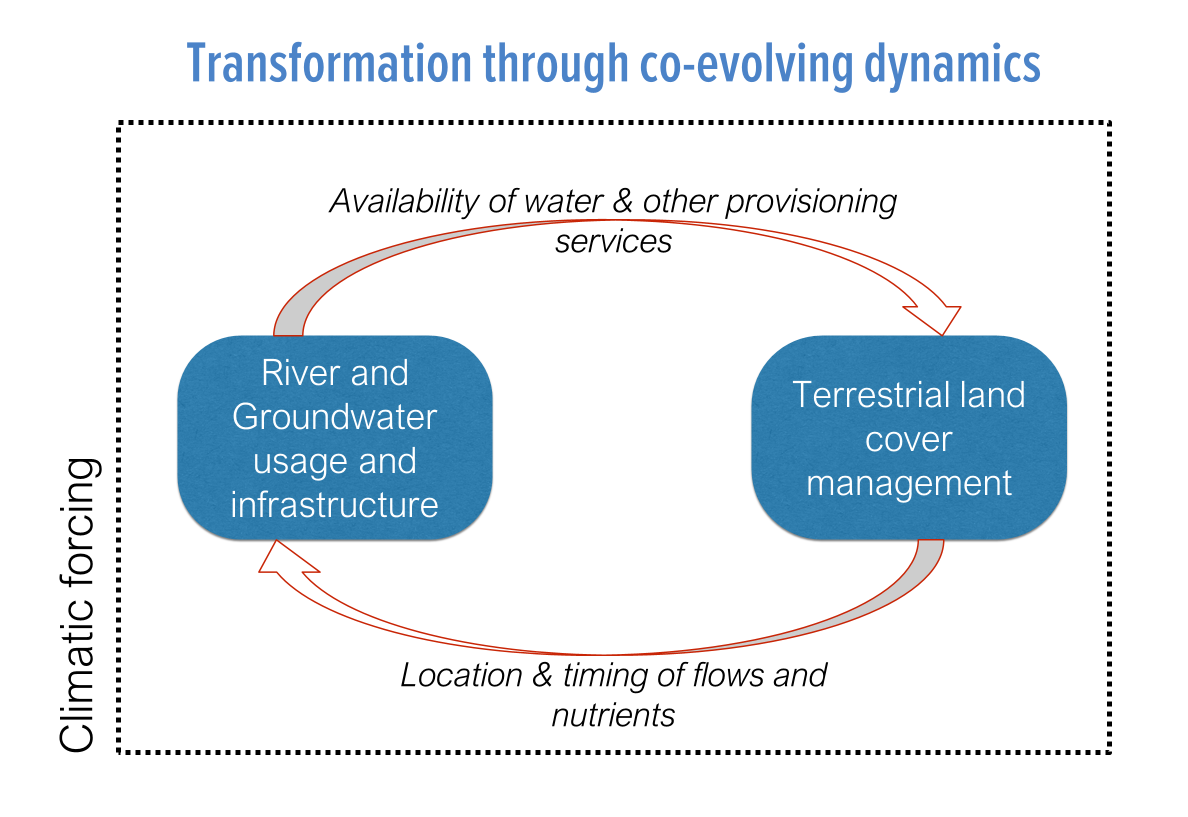 Figure: Co-evolving dynamics of a freshwater system
Step 4: Selecting Scenarios Narratives
-
Outcomes of step 3 provide several possible trajectories. These are now classified with stakeholder involvement into a list of least to most relevant scenarios affecting freshwater health. This may require developing a criterion for selection or selected by using a survey instrument.
-
Based on step 1, n scenarios are selected for further refinement. Through step 3 and 4, now a a short-list of scenarios of interest can be selected and further details added as required to create narratives of what each scenario attempts to depict.
Step 5: Framing Scenarios through Indicators
Now, with narratives for each scenario & an understand of the modeling requirements for the forces, the scenarios are mapped to indicators. With For each ith (of n) scenario, map indicator to scenario:
-
Indicator [j] can be directly calculated from models that account for all driving forces. Can calculate new values with high confidence & low-mid uncertainty.
-
Indicator [j] can be directly calculated from models that account for some of the driving forces. Can calculate new values with Medium confidence & high uncertainty.
-
Indicator [j] cannot be directly calculated from models that account for any driving forces. Assign direction/estimate change with low confidence & high uncertainty.
Step 6: Modeling Scenarios
Since the type and scope of scenarios selected can be large, this is not the place to go into an in-depth review of the models available that may be relevant for modeling the numerical state of the indicator with a certain type of scenario. However, from experience, these 3 categories of models/modeling framework will likely prove useful:
-
Minimum requirement: Hydrological model capable of changing climatic forcing, land surface forcing
-
If infrastructure changes are important: Hydraulic model or reservoir simulations, Water Resource Allocation model
-
If water quality/transport is important: Water quality/Nutrient transport model